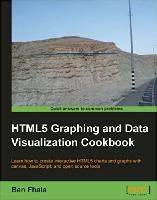
 HTML5 Graphing & Data Visualization Cookbook
4.6/5 stars on Amazon
Claim your FREE 344 page HTML5 Data Visualization eBook
Get a complete grounding in the exciting visual world of Canvas and HTML5 using this recipe-packed cookbook. Learn to create charts and graphs, draw complex shapes, add interactivity, work with Google maps, and much more.
Build common charts through step-by-step recipes
Add interactivity to Canvas elements and create your own JavaScript animation engine
Discover many fantastic charting solutions and learn how to deal with their capabilities and how to change them as well
Learn how to work with Google Maps, Google Charts, and Google Docs API
Iconic One Theme | Powered by Wordpress